# Best SMC Scalping Strategies
We will show you one of our Advanced scalping strategies in a one-minute time frame based on the smart money concept, which is so accurate and insanely profitable that it will take your trading to the next level.
Like the other scalping strategies, we will not use indicators as entry reasons to execute a trade. Instead, we will use them as confirmations of our entries, so forget the other nonsensible scalping strategies, which use indicators and get full concentration to apply this Advanced scalping strategy in your trades which is profitable and trustable.
**You need to have a full understanding of these topics**
* Order Blocks
* Break of Structure
* Change of Character
* RSI
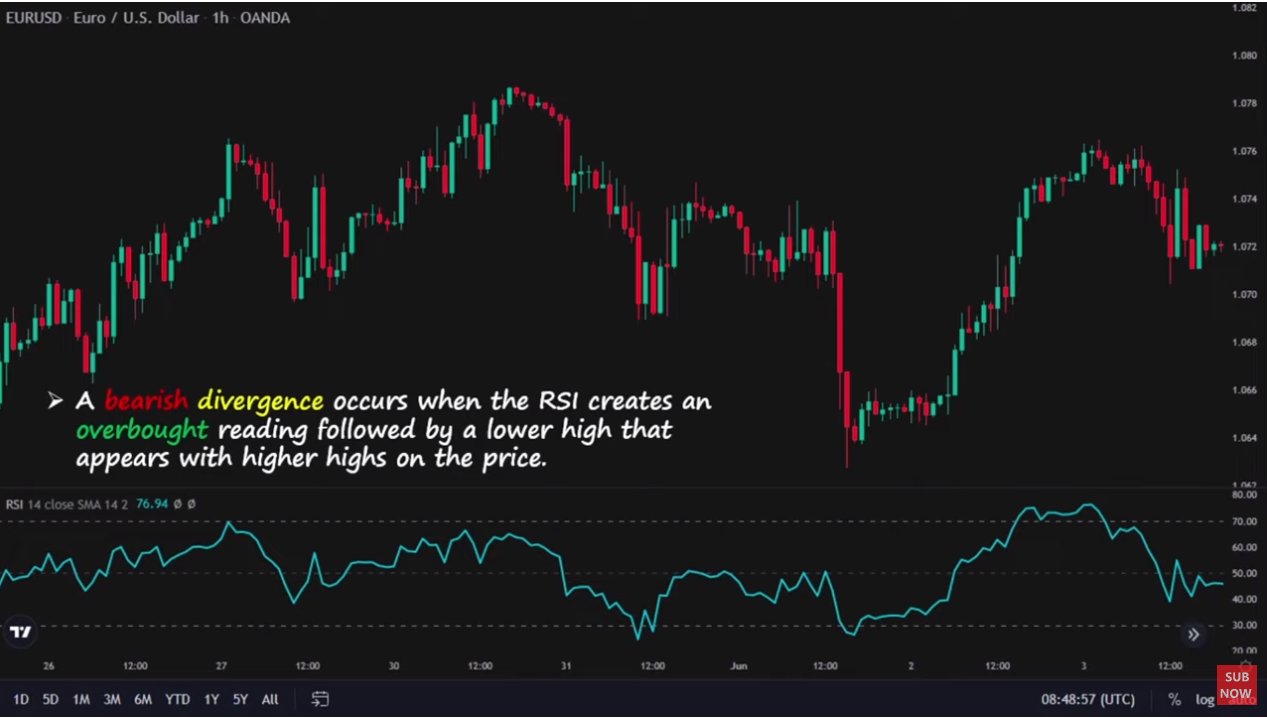
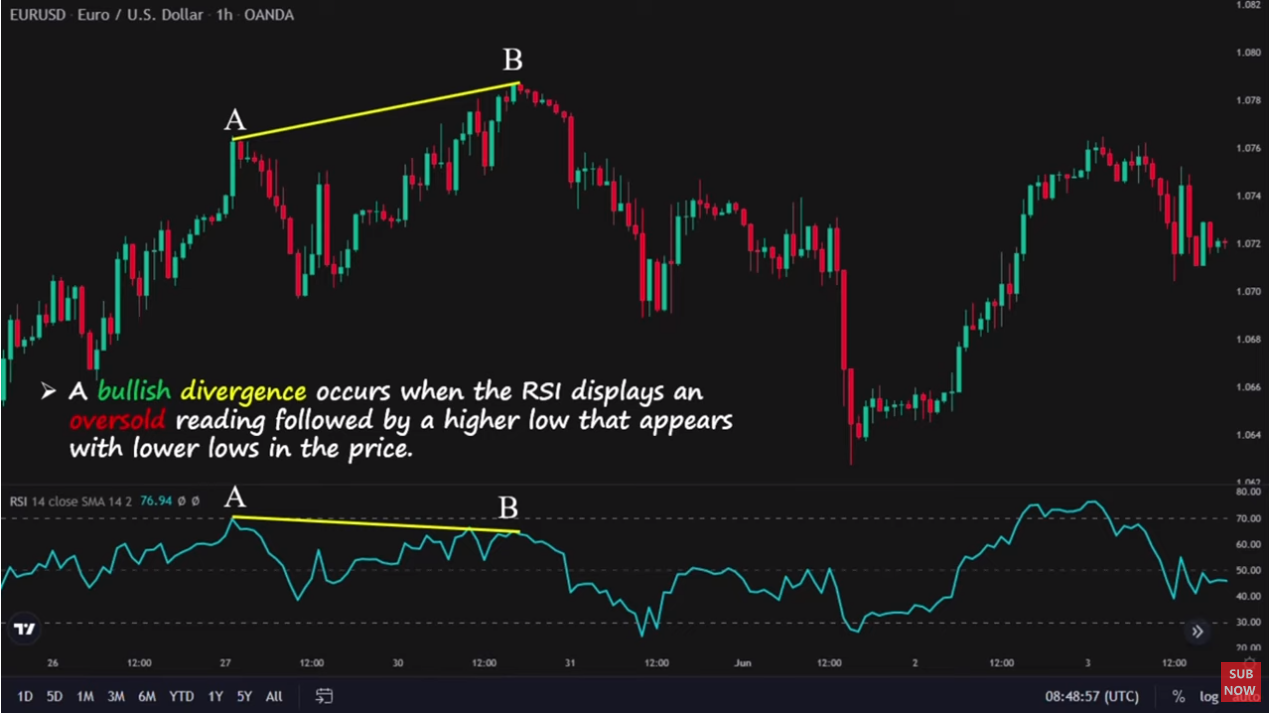
**RSI Divergences**
### Trading Plan
This strategy has four major steps that you must follow
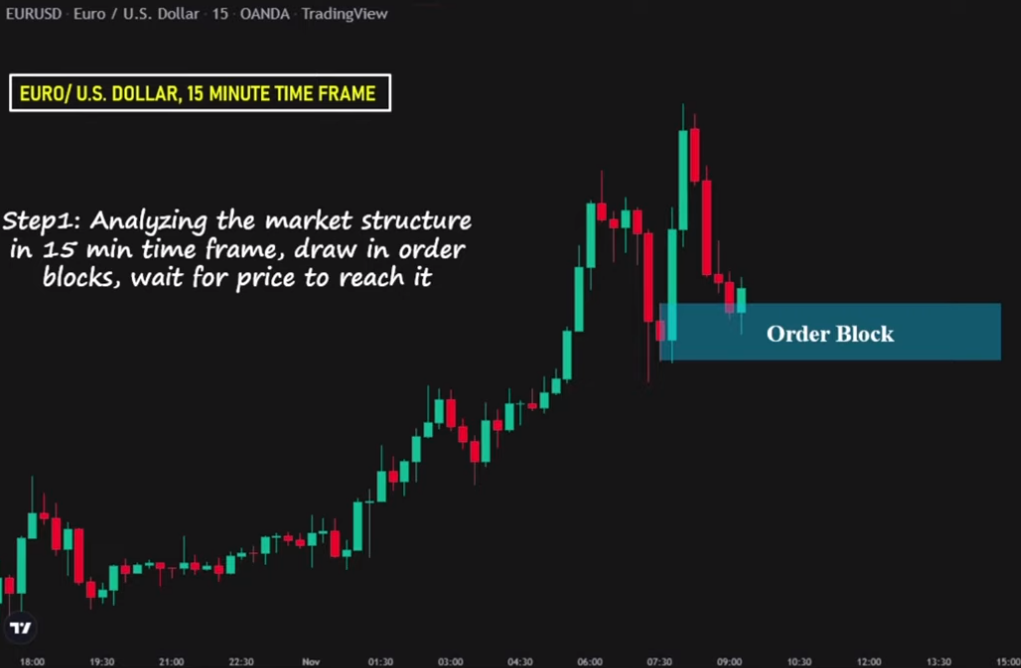
* Analyze Market structure in the 15-minute time frame and draw in order blocks and wait for the price to reach it
* Going through in a one-minute time frame and wait for the price to form a change of character then draw a new one-minute order blocks and wait for the price to get to our one minute order blocks
* Analyze RSI indicator in one-minute time frame looking for Divergence signals as a confirmation for our entry step
* After validation of all steps we will place a trade in one-minute time frame
## **Step-1**
Now we have to wait for the price Price reach the order block, as you can see the price in the order block Zone.
## **STEP-2**
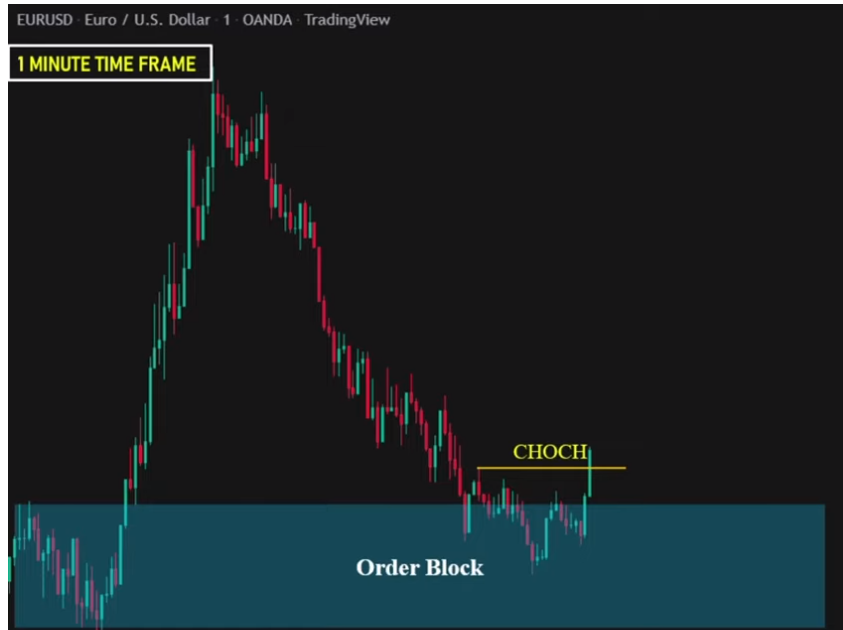
In the second step, we should zoom into our one-minute time frame and wait for the price to form a character change. Then, we will draw in a new one-minute order block.
As you can see in our one-minute time frame, we are facing a strong downtrend. That price reached our 15-minute order block, so in the Second Step price must show us a change of character, we will have no trade if the price makes a change of character.
Forming a change of character by Price here indicates that Price is no longer in a downtrend, and it can potentially change its direction.
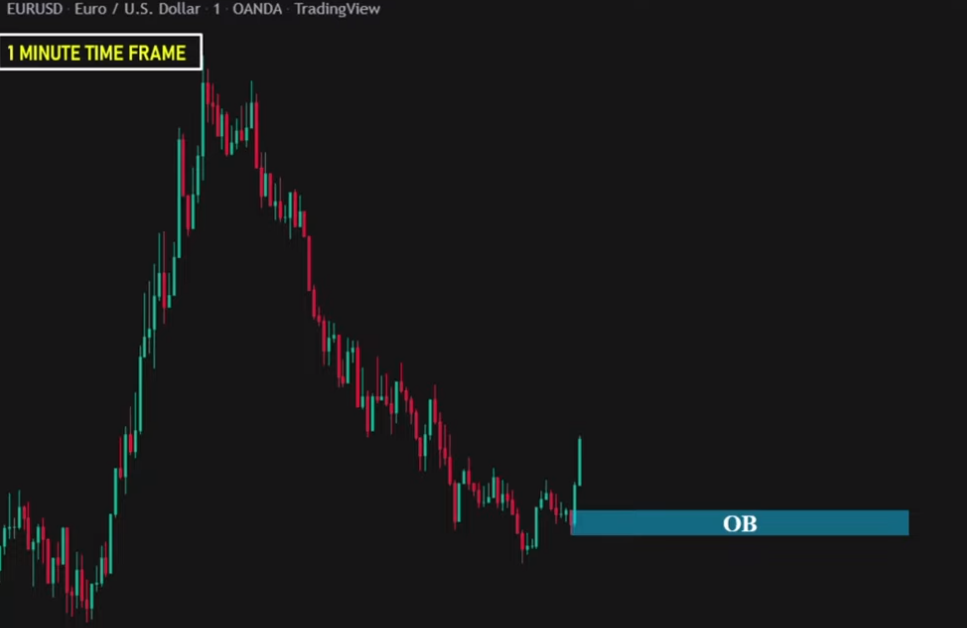
So next, we should spot the new one-minute order block. As you can see here, this zone is an order block generated by the movement of the change of character.
## Step-3
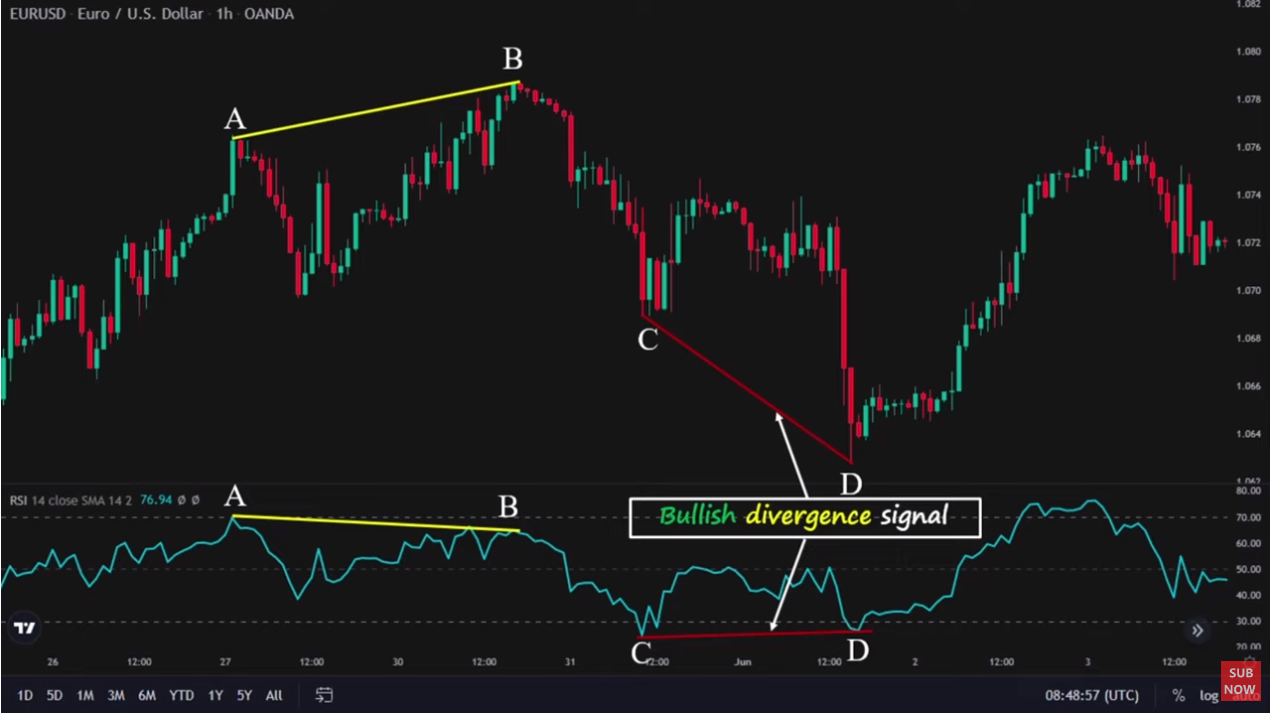
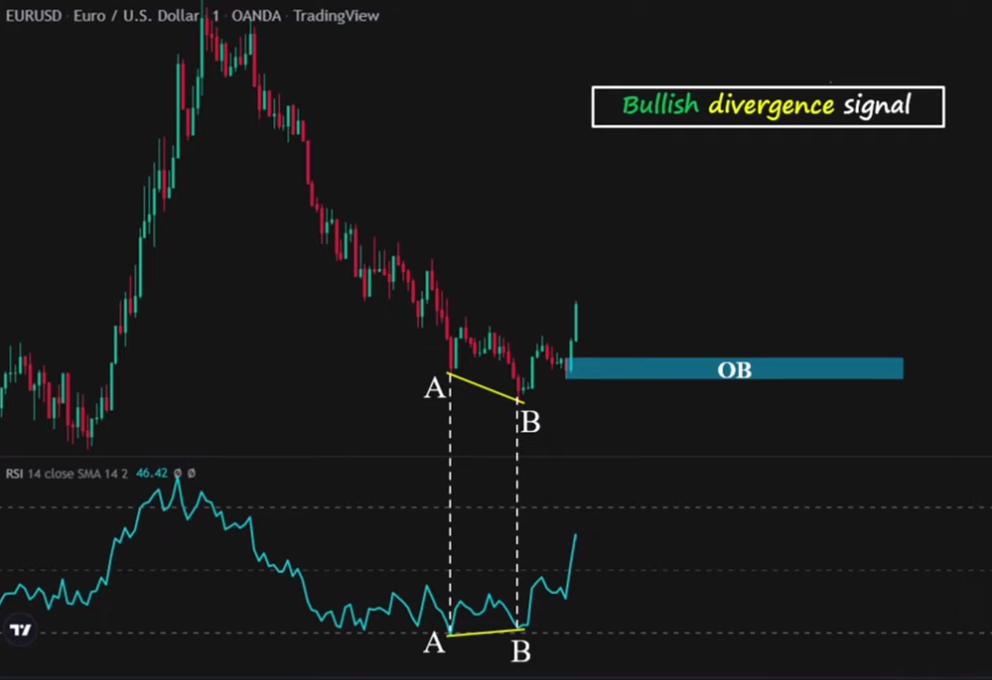
So now, in the third step, we should analyze the RSI indicator in the one-minute time frame and look for potential Divergence signals as a confirmation for our entry.
So here, we added the RSI indicator to our price chart; now, look at the A and B points. If we draw a line between them, it is obvious that the price is making lower lows.
Now look at the corresponding A and B points on the RSI chart here again; we draw a line through A and B, and as we would see, the RSI is making higher lows. The RSI indicates a bullish Divergence signal, so we have the confirmation for the entry we were looking for.
## **Step 4**
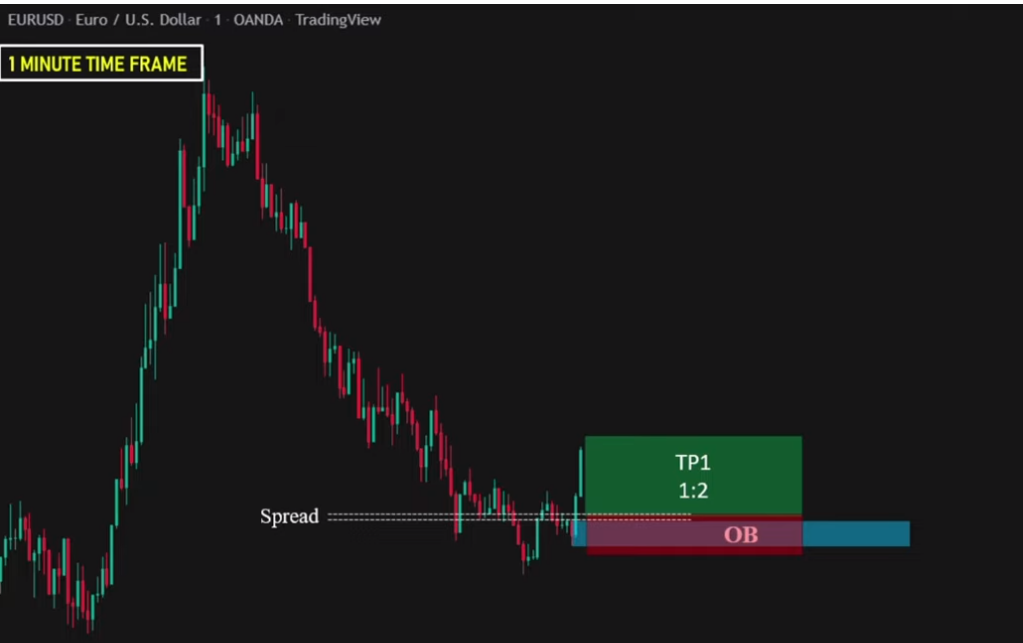
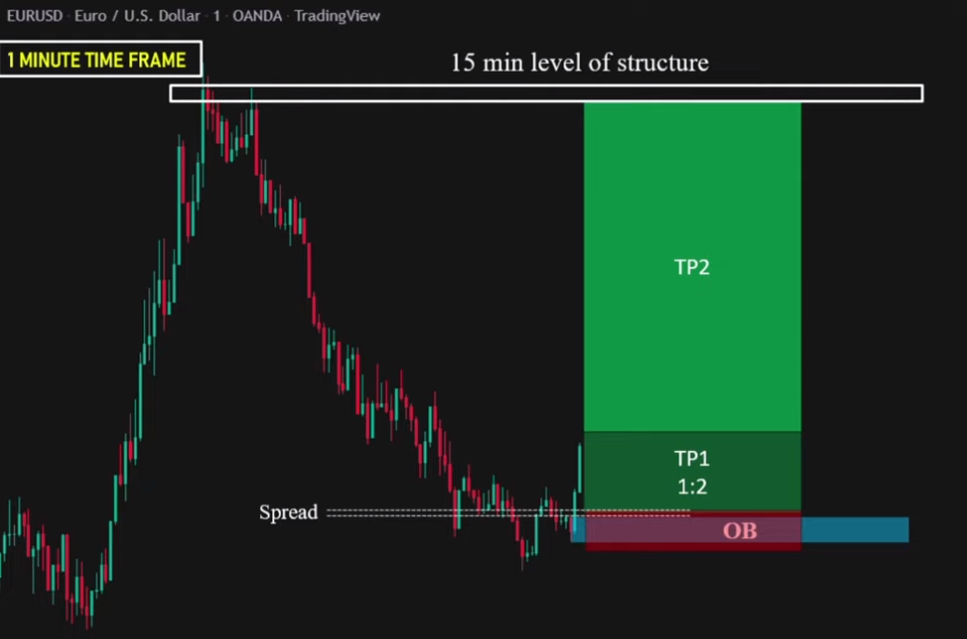
We should place our order in the order block area. Let's take a closer look at our last step.
In this scenario, we place our order here a spread size above our valid one-minute order block with a stop loss being a couple of Pips below the lowest point of the area with 1.5 Pips spread on the Euro US dollar pair; our stop loss is roughly 5 Pips.
For the first take profit, you could close half of your position when the price reaches one to two Targets. This. the Way, even price drops and hits the stop loss, you are still at break even and
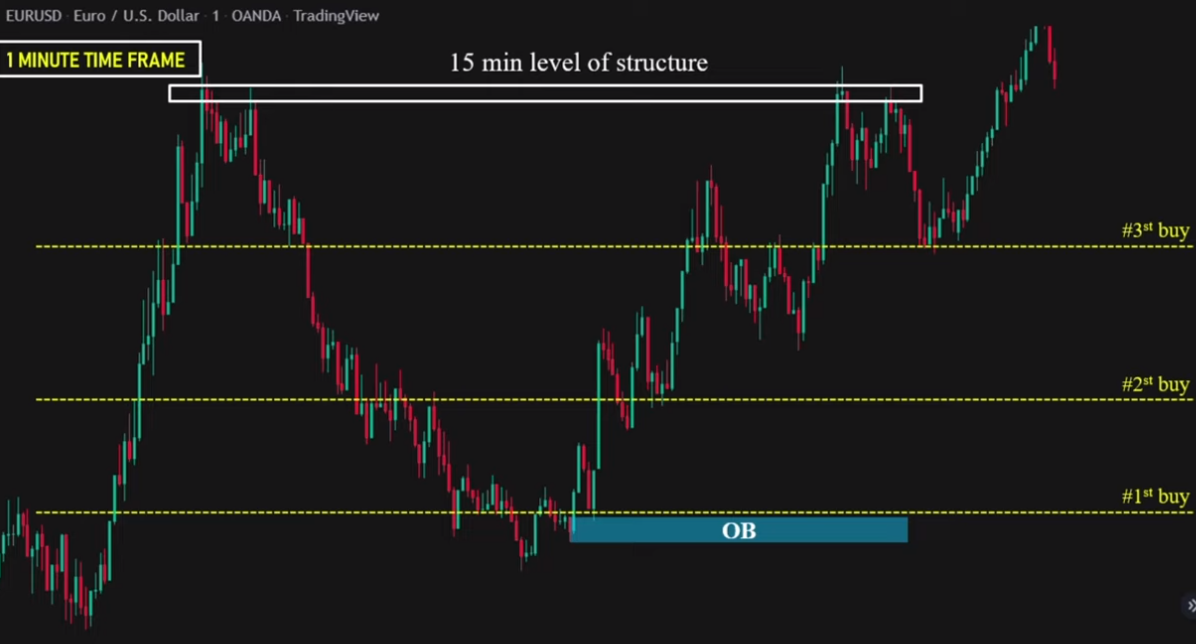
For the second take profit, you could Target the next major level of structure in front of the market in the 15-minute time frame, or you could also keep track of your profits, meaning that every time the price makes a higher low, you move your stop loss a couple of Pips below the lowest point of the high or low
Also, we can look for further entries as the price keep going upside every time that price forms a new order block. We can place a new order with a lower risk.