# Camarilla Pivot
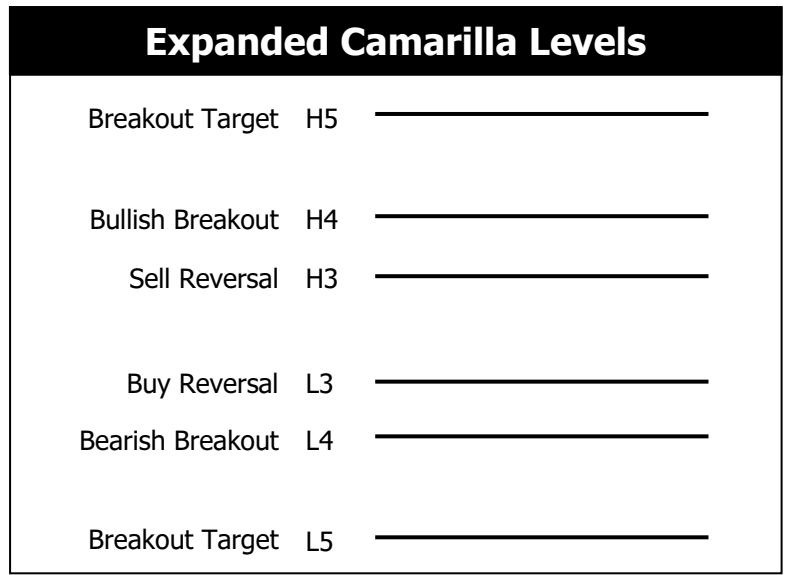
The Camarilla Equation offers a series of support and resistance levels, each carrying a specific call to action between L3 and H3 is the Camarilla version of the value area.
The equation's most watched and important layer is the third layer of support and resistance (L3 and H3). Once the market reaches these levels, you typically see a reversal toward the mean. Therefore, you are typically looking to sell the market at H3 resistance and buy the market when the price tests L3 support.
L3 and H3 are where responsive market participants will likely enter the market to push the price back toward an area of prior value.
The fourth layer of support and resistance (L4 and H4) is important. This layer is the last line of support or resistance and is watched closely for a breakout or reversal. While the third layer of the indicator visually represents where responsive market participants are likely to enter the market, the fourth layer illustrates price levels where initiative market participants are likely to act. Therefore, we look for reversals at H3 and L3; at L4 and H4, we look for reversals and breakout opportunities.
The L5 and H5 of the equation generally serve as a target should a breakout through L4 or H4 occur. The Camarilla Equation is like a built-in trading system, complete with entries, stops, and targets all built into one indicator.
***There are two basic setups that the Camarilla Equation offers:-***
**Two reversal plays**
**Two breakout plays**
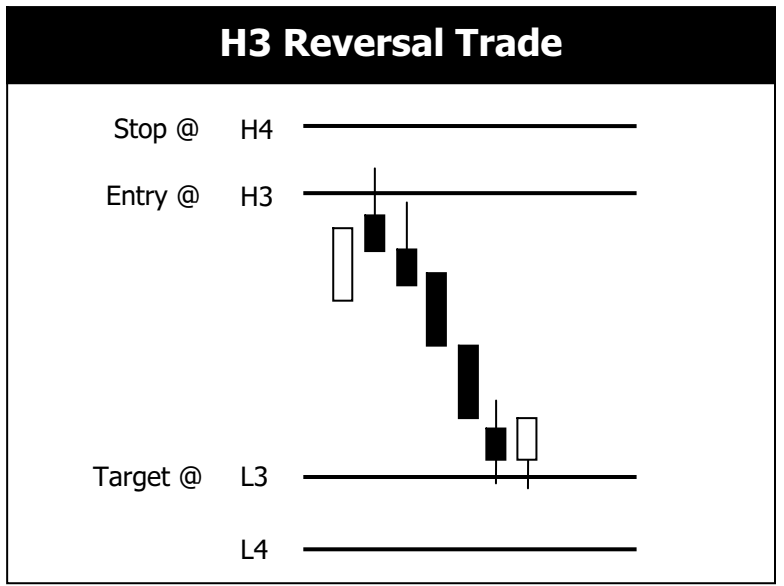
**H3 Reversal setup:** When the market advances to the red H3 pivot level andbegins to lose momentum. At this point, responsive sellers will likely enter the market and push the price back toward perceived value. Any signs of weakness at H3 should be viewed as a selling opportunity. SL should be set just above H4, with L3 as the target.
Things to look out for confirmation of trade at H3
Has H3 coincided with visual price resistance in the chart?
Has the price been in a downtrend for the last few days?
Have any key candlestick setups formed at this pivot level?
How the following bar reacts after the initial test at H3 occurs.
The current trend, the prior day's price behavior, and where the price opened the current session about the pivots.
**Additional factors to consider before entering the trade:**
The prior day's trading activity can greatly influence the next day's trading behavior. Therefore, if the prior session was a Trend Day, you are more likely to see trading range behavior in the next day's market, which means reversals at H3 and L3 are more likely to occur. Similarly, any pullback to L3 should be seen as a buying opportunity if the market has been trending higher. Likewise, if the market is in an existing downtrend, any pullback to H3 should be viewed as an opportunity to sell the rip.
Suppose the price is trading in a clear range the prior session, and the price opens within the prior day's range. In that case, it indicates that continued trading range behavior was likely to occur until a breakout from the range proves otherwise.
**L3 Reversal setup:** L3 Reversal trade is an inverted version of the H3 reversal trade
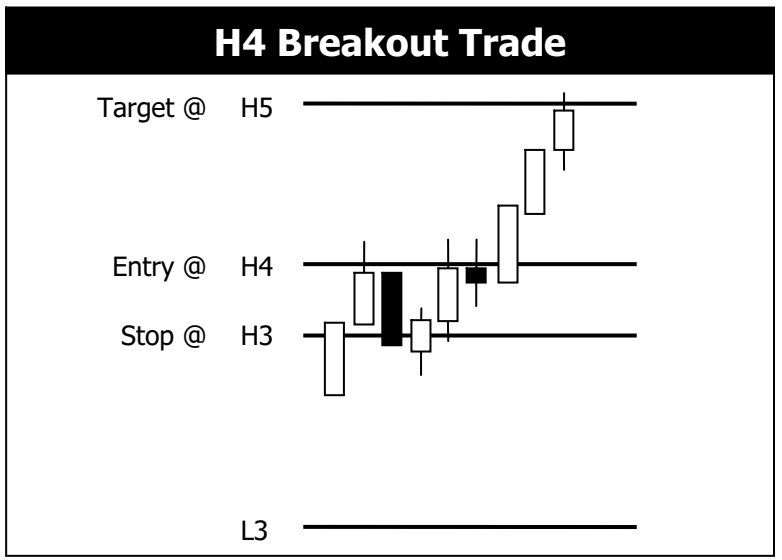
**H4 breakout setup:** H4 is the last line of defense; if a break occurs through this level, you typically see a rush of buying pressure that catapults price vastly higher as initiative buyers begin to step into the market to advance price to a higher value.
The basic premise of this setup is to trade a breakout through H4 resistance with a target set to the H5 pivot level. Stops are held at, or just below, the H3 level. A close above the H4 resistance level is typically the confirmation required for a bullish trade.
H4 is the last line of resistance, where both bulls and bears battle for control. This struggle causes the price to wick resistance many times before direction is ultimately decided. Usually, the market does not break H4 at the first test; the price gets rejected at H4, takes support at H3, and then breaks H4. The key is that price needs to test the H4 pivot level and close above this resistance line, ultimately confirming the long trade.
Things to look out for confirmation of BO trade at H4:
The current trend, the prior day’s price behavior, and where the price opened the current session about the pivots.
**L4 breakout setup:**
The L4 breakout Trade is an inverted version of the H4 breakout trade.
**CAMARILLA WIDTH ANALYSIS**
We use the width of L3 and H3 for camarilla pivot width analysis.
An abnormally wide pivot width usually leads to trading range activity, while an abnormally tight or narrow pivot width typically yields breakout and trending behavior. When the width of the pivots is unusually wide or unusually narrow, the chances for forecasting price behavior increase. If the pivot width is of average size, then no real behavioral cues can be gleaned with any degree of accuracy.
How the market opens the session regarding the prior day’s range and value allows you to judge the market’s-conviction and for acceptance or rejection of our pivot width analysis forecasting.
If the pivot width is abnormally wide for the following day, it is safe to forecast a Sideways or Trading Range Day market bias. However, this view will be accepted if the market opens within the prior day’s range and the third layer of the indicator for the current day. If the market opens the day outside the prior day’s range or the third layer of the indicator, a market conviction will lead to a different outcome.
Acceptance of a narrow pivot range forecast occurs if the price opens the day beyond the prior day’s price range and, preferably, outside the third layer of the Camarilla indicator. This indicates the market is ready to seek new value, thus confirming the breakout or trending behavior that narrow pivots typically forecast.
Pivot width analysis and pivot two-day relationships allow you to forecast the market’s anticipated behavior for the next day; this forecast will need to be confirmed by the market open with acceptance. If the open market rejects the forecast, a different outcome will occur.
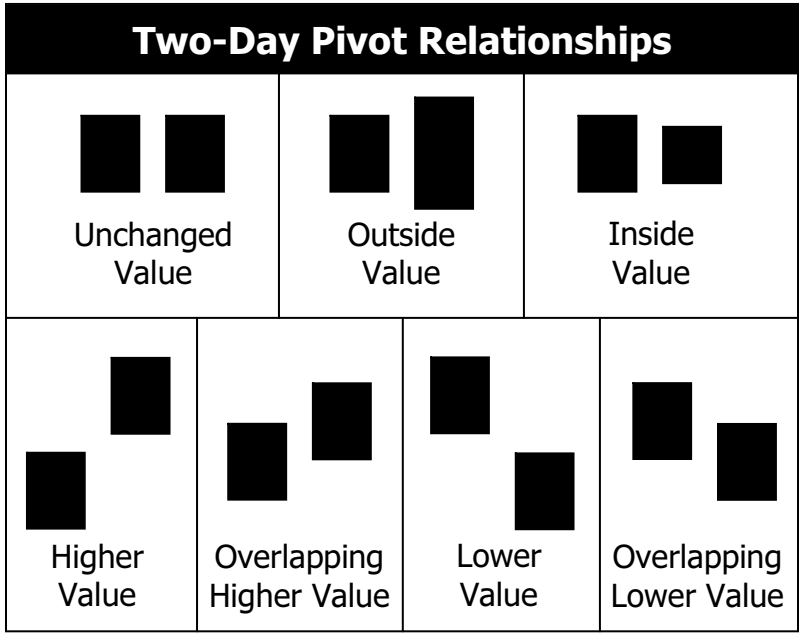
**Two-Day Camarilla Relationships**
Two-day relationships are extremely important when using pivots in your trading. These relationships give you directional bias and allow you to anticipate potential market behavior for the upcoming session.
| Relationship | Potential Outcome |
| ------------------------ | ------------------ |
| Higher Value | Bullish |
| Overlapping Higher Value | Moderately Bullish |
| Lower Value | Bearish |
| Overlapping Lower Value | Moderately Bearish |
| Unchanged Value | Sideways/Breakout |
| Outside Value | Sideways |
| Inside Value | Breakout |
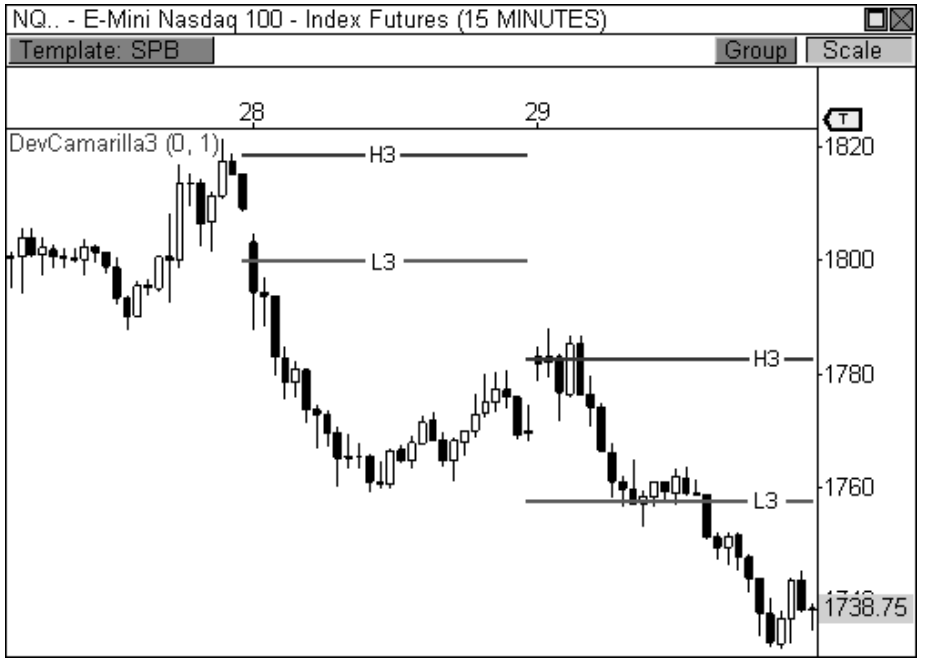
Lower Value
If the market opens at or below the H3 pivot level, we will look to sell any pull-back to H3, as this opening price would indicate acceptance of the current two-day relationship. Rejection of the two-day relationship will occur if the price opens above, thereby leading to the H3 pivot level, as this opening behavior would indicate a profound change in sentiment from the prior day, thereby leading to a potential advance.
Suppose the price opens right at the H3 pivot level. In that case, neither acceptance nor rejection is confirmed, but err on the side of acceptance; if the price hasn’t opened beyond the H3 pivot level, look for any signs of weakness to confirm a potential drop to new lows.
Lowe Value Relationship
**Several factors led to the successful outcome of the lower-Value initial analysis.**
The market had been in an existing downtrend, which means responsive sellers will be looking to sell any pull-backs in price. Therefore, you are aligning yourself with the right side of the market.
Secondly, the two-day Lower Value relationship is the most bearish Camarilla relationship. This relationship indicates weakness for the upcoming session.
And last, if the opening price shows full acceptance of our initial analysis, we can scout H3 for a potential sell entry.
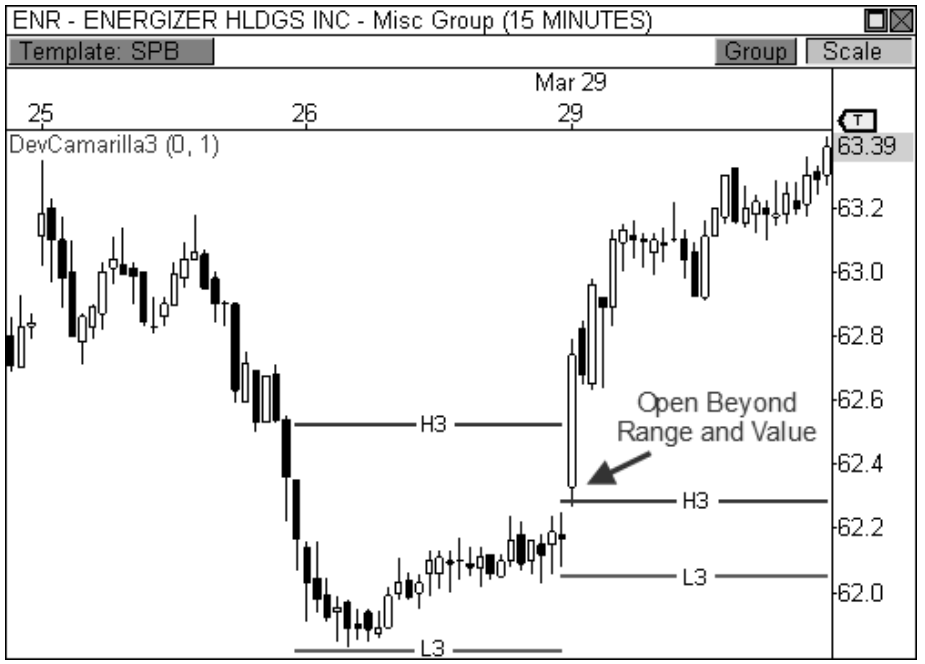
**The Inside Value**
Inside Value leads to explosive breakout opportunities in the market and is amplified if the current day's pivot width is unusually narrow. For the price to accept this forecast, the opening print should occur outside the prior day's range, preferably beyond the indicator's fourth layer. This behavior indicates the market actively seeks new Value with conviction.
Otherwise, if the price opens the day within the monastery's range and Value, much less conviction is anticipated, although a breakout could still occur. On breakout days, such as on narrow or inside relationships, continuation usually occurs if market gaps do not fill the gap in the first 15 minutes.
**Entry options in a bullish and bearish trend:**
When the market is trending higher and has developed a Higher Value or Overlapping Higher Value relationship, you will look to buy a pull-back at either H3 or L3, depending on where the market opens the session. If the market opens the session above H3, the H3 pivot level becomes the pivot to watch for a bullish bounce. If the market opens the session below H3, but above L3, the L3 pivot level becomes the pivot to watch for a buying opportunity. Of course, if the price unexpectedly opens the session beyond the L3pivot level, especially below L4, you will look to sell the market, as the tide has likely changed, and a decline could be ahead.
In a bearish trend, you will look to sell any pull-back to L3 or H3, depending on where the market opens the session. If the price opens the day below L3, then you will look to sell a pull-back at the L3 pivot level. If the market opens the session above L3 but below H3, you will look to sell any pull-back to the H3 pivot level. Again, a major gap against the trend above the H3 or H4 pivot levels indicates a likely change in trend. Therefore, you will look to buy any pull-back at H4, or maybe even H3, as the market is likely headed higher.
THE HIDDEN LAYERS
The first and second layers of the Camarilla Equation are the hidden layers (H1, H2, and L1 and L2). The prior day’s range will dictate when it is useful to trade from the hidden layers of the indicator. In other words, when the prior day’s range is excessively larger than normal, the pivots for the following session become abnormally wide, thus allowing you to profit using these hidden layers.
When this occurs, you can ignore all pivots outside L3 and H3, as the market will likely become trading rangebound. Therefore, unlike the Money Zone and Floor Pivot indicators, the Camarilla Equation provides a better way to play Trading Range and Sideways Days when the pivots are unusually wide. If the next day’s pivots are wider than normal and you are looking to trade a reversal off H3 to the traditional target of L3, you are less likely to reach your target since these pivots are spaced wider apart than normal. You may not even have a chance to trade an L3 or H3 reversal because the pivots may be so wide that the price may never venture out from the inner two layers of the indicator.
The Hidden Layers (H1, H2, L1, and L2) are always played for reversals like the third layer of the indicator and not for breakouts.
As a rule of thumb, anytime the market experiences a trending session or a session with a wide range of movement, you will want to consider turning on the hidden layers of the indicator the following day. In this type of session, you must be decisive at the point of entry and steadfast to your target.
Any of the key reversal patterns can be very useful on this type of day, and the ambusher's technique also becomes especially important. Remember, on these particular trading days, volatility is typically very low; therefore, you are looking to take quick profits while limiting your risk.
THE CAMARILLA BREAKAWAY PLAY
True Trend Days typically begin the day with a bang, usually with a price gap that occurs beyond the prior day’s range and value. However, you do not want this to be your first indication that a Trend Day is in full swing. Instead, a fully prepared trader will use this information as confirmation that a Trend Day has started since pivot characteristics (narrow pivot width or the Inside Value relationship) would have already alerted the trader to the possibility of a Trend Day outcome.
On these types of days, H5 is reached much too early in the trade; use H5 to take partial profit and stay in the trade for a much bigger profit.
While narrow pivots and the Inside Value relationship allow you to spot a potential Trend Day easily for the upcoming season, unexpected breakouts can sometimes offer huge results.
PIVOT TREND ANALYSIS
Do not claim to know what the market will do at all times. Still, when the market falls into a familiar routine, it is your responsibility as a trader to quickly and accurately identify and diagnose the situation so that you may deploy your capital most responsibly. Trading is about finding those familiar patterns in the market and capitalizing on the highest probability opportunities.
Smart money enters positions at the most favorable in the chart, and pivot trend analysis allows you to spot these opportunities with the best of them. Every pull-back to H3 should be a selling opportunity during a bearish trend, while every retracement to L3 should be a buying opportunity during a bullish trend.
Plan your trade and trade your plan. Create a plan for market bias forecasting using pivot width analysis, trend analysis, and pivot two-day relationship, and then let the market prove or disprove your hypothesis by its opening print. Approaching the market in this manner significantly increases your chances for success.