# Central Pivot Range
The Central Pivot Range (CPR) is, without a doubt, the most powerful part of the Floor Pivots indicator. Some authors have called the range the meat of the market, while others refer to the central pivot point as the heartbeat of the indicator. In my opinion, the central pivot range is the Swiss Army knife of pivots. At any given time, the range can be support or resistance; it can forecast trending or sideways price behavior, dictate the day's direction, or be an integral part of a trend.
This range can tell you so much about the potential movement of the upcoming day and even how the prior day transpired. Moreover, the placement of the CPR can give you a certain bias about the upcoming day. Knowing the location of the CPR at all times allows you to keep your finger on the market's pulse and provides you with a significant trading edge. In trading, an edge is all you need to make money.
> Like the Moon, the central pivot range controls the tides of the market
Similar to pivots, we dont need to calculate CPR now as most of the charting software gives this as an Indicator. Still, I am adding the formula to calculate CPR. CPR consists of three levels Pivot, Top Center, and Bottom Center.
I am referring to the level above the central pivot point as TC, while the level below the central pivot point is BC.
**Two-Day Pivot Relationships**
Seven types of pivot range relationships should be considered when analyzing the market's current strength and attempted direction: Higher Value, Overlapping Higher Value, Lower Value, Overlapping Lower Value, Unchanged Value, Outside Value, and Inside Value. Each pivot range relationship brings with it a directional bias or expected outcome.
| CPR Relationship | Expectation |
| ------------------------ | ------------------- |
| Higher Value | Bullish |
| Overlapping Higher Value | Moderately Bullish |
| Lower Value | Bearish |
| Overlapping Lower Value | Moderately Bearish |
| Unchanged Value | Sideways / Breakout |
| Outside Value | Sideways |
| Inside Value | Breakout |
Higher Value
You must let the market prove each relationship through the day's opening price.
Overlapping Higher Value
Overlapping Lower Value
Unchanged Value Relationship
Outside Value Relationship
The Inside Value Relationship is Most Explosive
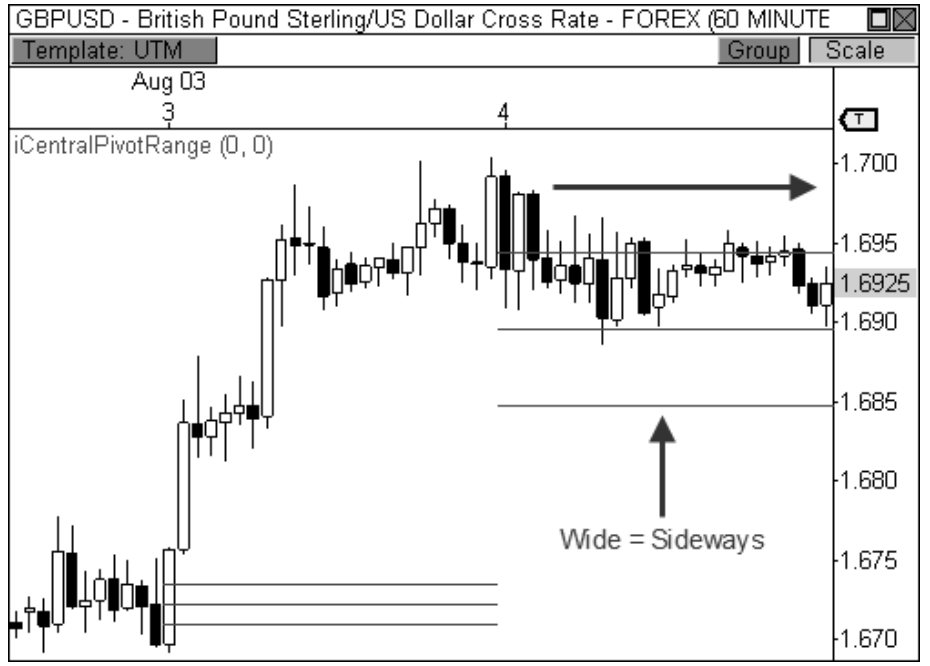
**Pivot Width Forecasting**
A tight central pivot range can be dynamite. You want to be aware when a day has the potential to start off with a bang.
A Narrow CPR
The CPR can be Narrow, Medium, or Wide. Three scenarios can occur based on CPR Width.
| CPR Width | Outcome |
| --------- | ------------------- |
| Narrow | Trending Day |
| Medium | Moderately Trending |
| Wide | Sideways |
Do note the outcome is the most likely thing that can occur, but it is not 100% guaranteed.
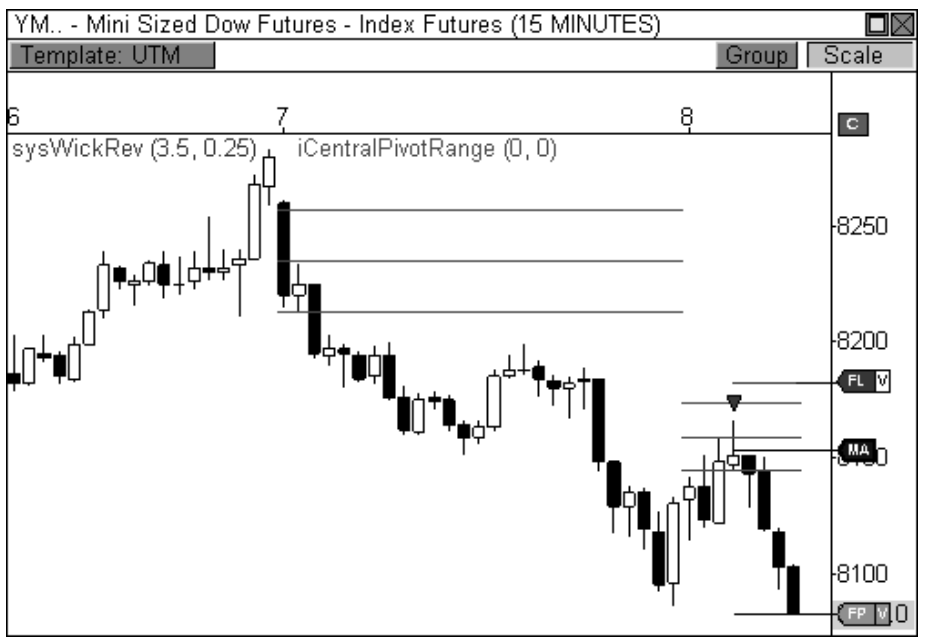
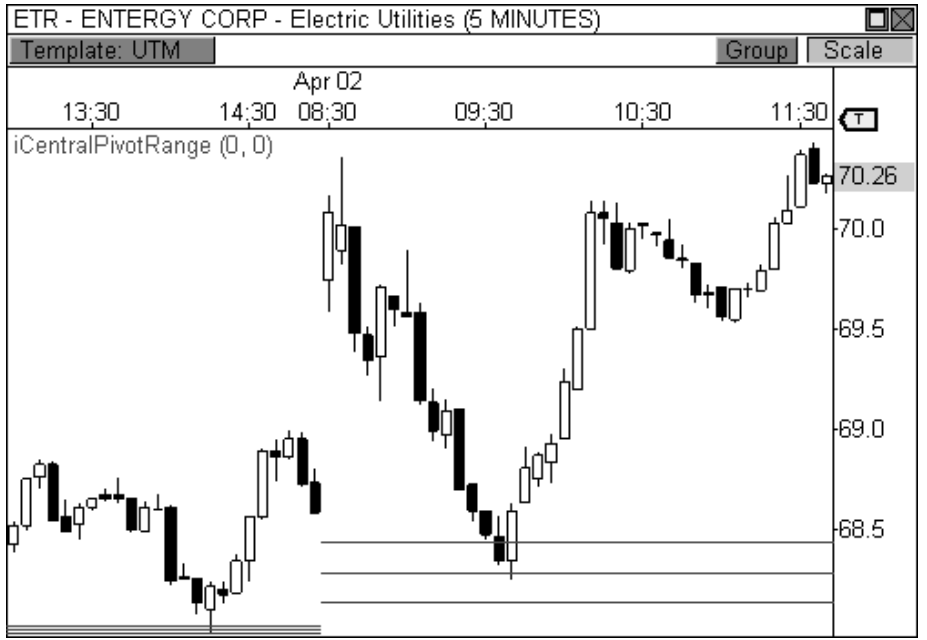
**Pivot Range Trend Analysis**
Playing the bounces off the central pivot range in the direction of a prevailing trend is a prudent course of action.
Remember the two-day pivot range relationships we discussed earlier, like the Higher and Lower Value relationships? When these two-day relationships develop, the goal is to play the bounces in the direction of the trend. With longer-term pivot range trend analysis, the goal remains the same, except many more days are strung together.
CPR will remain beneath an uptrend to serve as support on the way up while remaining above a downtrend serving as resistance on the way down. Essentially, each pull-back to the pivot range is a buying opportunity within an uptrend and a selling opportunity in a downtrend.
Price remains above (or below) the centrals throughout a trend until. It either stalls or changes direction. A strong trend can usually be gauged by how the prPriceemains above the bottom central pivot (BC) while in an uptrend and below the top central pivot (TC) while in a downtrend. Once the prPriceiolates this paradigm by closing beyond the range for the day, you see either a trend change or a trading range market develop.
When the prices trend lower, breaking above the pivot range and close closing above this, it essentially breaks the existing downtrend and creates a new bullish trend. When this occurs, you will look for a price to hold above the central pivot range for two consecutive days. IfSupposerPriceuccessfully uses the central as support during these first two days. In that case, any pull-back to the CPR during the uptrend should become a buying opportunity, otherwise known as “buying the dip.
Study the price behavior closely at the central pivot range early in the day for signs of a bounce in the direction of the prevailing trend when the market has formed a Higher or Lower Value two-day relationship or a series of these relationships in a trend. Pull-back opportunities usually occur early in the session, with follow-through occurring the rest of the day. As such, any pull-back to the range early in the morning is a buying or selling opportunity depending on the direction of the trend.
**The Magnet Trade**
A gap at the open indicates that market sentiment has changed overnight, and the market is poised to move in the current session. When this occurs, use the pivots to trade a potential breakaway move or fade the market to fill the gap.
We have discussed methods for snuffing out and trading the highly profitable breakaway days using the pivots. In this section, however, we will discuss how the central pivot range can have an amazing magnetic effect on prPricehat can lead to a high percentage fill of the morning gap.
If Price opens the day with a gap and the centrals are back near the prior day’s close, you typically see a fill of the gap a high percentage of the time, given the right circumstances. This is the Magnet Trade, since the centrals attract Price, causing a fill the gap. The gap will be the target level. When price gaps are up, you should see signs of weakness and a reversal candlestick setup to take entry.
Trading the right size gap greatly increases the success rate of this setup. Gaps that are too large don’t tend to fill as easily as those that are moderate in size.
Also, you must remember that the goal of the trade is to play for a fade of the gap back toward the central pivot range, which means the trade will usually be short and sweet. If you can get more out of the trade, go for it. But don’t wait all day for a gap to fill because the longer the trade takes, the more unlikely it is to fill.
The trend can also play an important factor in the successful outcome of a magnet trade. When a market has formed an established trend, the price will usually pull back to the pivot range before resuming in the direction of the trend. Therefore, if the market has formed an uptrend and price gaps in the direction of the trend (up), there is a good chance that the price will drop to the pivot range before another round of buying pressure is seen, thereby causing a fill of the gap. This market behavior aligns perfectly with the essence of the magnet trade.
Another important factor to consider when trading this setup is looking for additional pivot confirmation that can add to the success of your trade. If price gaps are up to R1 resistance or down to S1 support, these pivots can serve as a barrier to a breakaway trade, which leads to a higher percentage of filled gaps.
I am much more open to trading this setup when the market is up at the open rather than down. A gap down requires much more confirmation, conviction, and volume to fill the gap on most occasions. However, having clear pivot support at S1 can help the price reach its objective in many cases.
Too much resistance can be a pitfall when playing the magnet trade.