
Harami Patterns
What is Harami Candlestick Pattern?
The Harami candlestick pattern involves two candles. One large candle precedes a small candle. And the body of the large candle completely engulfs the body of the next smaller candlestick. The pattern looks like a lady is carrying a baby in her womb. That is why the candlestick pattern was named Harami in Japanese.

What does a Harami pattern indicate?
The Harami candlestick pattern usually gives us trend reversal signals. Different types of Harami candlestick patterns give trend reversal signals. The trend reversal signals can be either a bullish trend reversal or a bearish trend reversal.
The strength of the signal depends on how the trader interprets the pattern. These signals can only give potential reversal trends, but this can not be decisive. The trader has to make decisions depending on the market scenario.

What are the 2 types of Harami Candlestick patterns?
There are basically two types of Harami candlestick patterns on the basis of interpretation.
One is the Bullish Harami Pattern which gives a bullish trend reversal signal.

Here the bullish harami candlestick pattern shows a large red candle followed by a small green candle. This is typically what the bullish harami pattern looks like.
There is another pattern known as the bearish harami candlestick pattern.

Two candlesticks form the bearish harami pattern. A small red candle follows a large green candle. This is what a typical bearish Harami pattern looks like.
There is also another pattern commonly known as Harami Cross. We will talk about this later.
What is a Bullish Harami Candlestick pattern?
A bullish Harami pattern gives a potential signal of the trend being reversed and bulls taking control over the bears. This candlestick pattern typically occurs at the bottom of a downtrend and the stock is oversold.
This candlestick pattern is opposite to the appearance of a bullish engulfing pattern. Though both patterns indicate a potential bullish uptrend after a long downtrend.

A pink colored shade shows the bullish Harami pattern in the chart above. This chart shows that the pattern occurred at the bottom of the long downtrend. The long downward arrow shows the downtrend.
This chart has a long red candle at the bottom of the downtrend. Followed by the long red candle, there is a small green candle. This combination is the bullish harami pattern. A pregnant mother can also interpret this pattern. The baby is small and green in color.
After the pattern is complete, we see a strong uptrend has emerged. This pattern also confirms that a bullish trend reversal has taken place. A trader may see this as a potential trend reversal when forming the pattern.
1. Bullish Harami confirmation pattern

A typical Bullish Harami candle pattern also gives confirmation on the third or fourth candle. Here, in the diagram above, we can see the third candle is a green candle confirming the uptrend. In the earlier bullish Harami diagram, we have seen that the fourth candle is a large green candle which gave confirmation of a new uptrend.
The confirmation candle should close above the previous green candle. The trader may enter the trade after getting confirmation from the chart pattern.
2. How to set up trade with a bullish harami pattern?
The following figure shows how to trade with a bullish harami pattern.

In this pattern, the first candle is a red candle which is a part of the existing downtrend. The next candle is a small green candle that completes the Harami pattern.
As we can see, the trade entry should be above the high of the second candle. It is best to take the trade on the third or fourth day when we get the confirmation candle.
The confirmation candle should close above the high of the second candle, Therefore if a trader takes entry near the closing of the third or fourth day when the confirmation candle is about to close above the second candle, it should increase the chance of a successful entry.
3. How to set a target & stop loss with a bullish harami pattern?

When a bullish harami is confirmed by a third or fourth confirming candle that is closing above the Harami candle, i.e., a second green candle, a trader may enter the stock. This chart shows a Harami candlestick pattern that was formed after a long downtrend (shown by a green rectangular box). The third candle gives confirmation by closing above the high of the second candle.
The trader is supposed to buy the stock near the close of the third candle (confirmation candle).
The stop loss should be just below the low of the first red candle.
Now, if we are trading at a 1:2 risk-reward ratio, the trader may exit at or near double the trading price – the stop-loss price. Otherwise, if the condition favors the trader, the trader may stay in the trade until the next downtrend occurs.
What is a Bearish Harami Candlestick pattern?
A bearish Harami pattern gives a potential signal of the trend being reversed and bears taking control over the bulls. This candlestick pattern typically occurs at the top of a downtrend and the stock is oversold.
This candlestick pattern is opposite to the appearance of a bearish engulfing pattern. However, both patterns indicate a potential bearish downtrend after a long uptrend.

The chart indicates where the bearish harami pattern was formed. It was formed right at the top of a long uptrend. At that time, the stock reached an overbought zone. After the pattern, the downtrend started.
The pattern was formed by a long green candle followed by a small red candle. The green candle showed the existing uptrend. And the Harami pattern started the downtrend with consecutive red candles.
1. Bearish Harami confirmation

We can see the bearish Harami confirmation above. A third candle closes below the second red candle or the harami candle. This confirmation candle shows that the downtrend has started.
The confirmation candle must close below the second candle. And the trader should take an entry near the close of the confirmation candle.
2. How to set up trade with a bearish harami pattern?
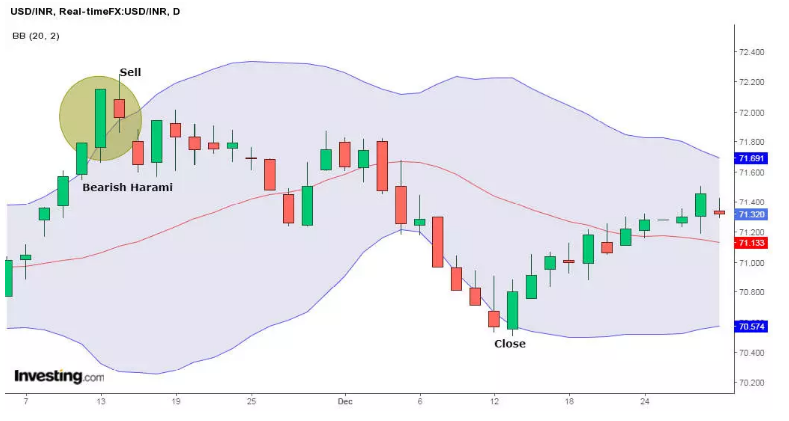
As is true with other indicators, Harami patterns also need confirmation from other indicators. Here in this chart, e have used the Bolinger bands and candlesticks. As indicated in the chart, when the bearish Harami pattern occurred, the Bollinger bands also showed that the stock was extremely oversold and was, therefore, ripe for a reversal to occur.
The trader will short-sell on the confirmation candle below the low of the second candle; at this time, the third candle has also shown that it is coming down from the Bollinger band extremes. It is the right time to enter a sell/ short trade.
The stop loss should be placed above the high of the first candle.
The trader should exit the trade when the currency pair reaches the other extreme band of the Bollinger band.
A cautious trader, who is trading at a 1:2 risk-reward ratio, may exit when the candle goes over double the high of the first candle – selling price.
3. How to set a target & stop-loss with a bearish harami pattern?

In the chart above, a typical bearish Harami pattern trade has been explained. The trade entry is just below the second candlestick. The stop loss is just above the high of the first candle.
Here the profit was taken at the last green candle. A big green candle follows the last red candle. The exit trade was taken at the last green candle when the high of the previous red candle was broken. It shows there is a possibility that the downtrend was potentially broken.
Identifying Bullish and Bearish Harami on a Trading Chart

What is the difference between the Engulfing pattern and a Harami pattern?
There is a distinct difference in appearance between a Harami pattern and an engulfing pattern.
An engulfing pattern has two candles; the first is a small candle, and the next is a large candle that completely engulfs the length of the previous candle.
But the Harami pattern looks just the opposite. There is a large candle that is followed by a small candle. This is a major difference, which is in appearance. Functionally they give similar signals.
What is a Harami Cross?

The Harami cross pattern is when the second candle looks like a Doji candle. It appears both in a bullish Harami pattern and a bearish Harami pattern. Basically, it is a combination of the Harami pattern with the star Doji.
The star Doji looks like a plus sign. But the Harami candlestick pattern principle applies here also. The star Doji should have small wicks and should be completely engulfed by the large previous candle.
Last updated